See what matters each week, what's driving it, and which levers to pull.
Brewery Brain connects the data from the systems you already run with what your team knows about the business. Each week, the team gets the few things worth its attention, and what's behind them.
- Point of sale
- Production and inventory
- Distributor depletions
- CRM
- Accounting
- What your team knows
Where we're taking your team.
Each step builds on the one before. Here they are on one margin problem at a demo brewery.
The problem: The numbers are spread across several systems, and the reasons behind them are scattered across notes and people's heads.
Connect everything you know.
Every night, the data from your point of sale, production, distributors and books comes together in one place, and the notes your team already keeps sit right beside the numbers they explain.
From the margin decline
Mar 11 · Priya N.
"Can supplier notice came in: aluminum going up starting next order, about three and a half cents on the 12 oz and five on the 16 oz."
The problem: There's more to watch than anyone has time for, and a problem often shows up in a report after it's already cost you.
See what matters most, every week.
Each Monday, the team sees the few numbers that are off track, by how much, and what's driving each one.
Blended gross margin
| Cost | −1.78 pts | almost the entire decline |
|---|---|---|
| Mix | −0.02 pts | barely registered |
| Price | 0.00 pts | unchanged since 2025 |
The problem: A change gets made, and a month later it's hard to say whether it paid off.
Know the right levers to pull, and check they worked.
You see a few options and their likely impact before you commit. The decision gets an owner and a follow-up date, and four weeks later the numbers show whether it worked.
The action
A $2 a case price step on the three canned flagships
Four weeks later
| Tideline Pale Ale | +$18,508 | in margin dollars |
|---|---|---|
| Marine Layer Lager | −$5,662 | cases down 20%, against the 5% the team expected |
It vacuums up everything the brewery already tracks or knows, and focuses the team on what matters most.
Your data
Connected automatically to the systems you already use and checked every night. Before anyone sees an insight, the numbers tie out to the reports the team already relies on.
What your team knows
Notes, the plan and the reasons behind the numbers, brought in alongside the data.
AI
Picks out what's most interesting across all of it and says it plainly. The decisions stay with your team.
Connected to the systems you already run
Point of saleTaproom sales
Which shift, server or menu item drove the number this week.
ProductionERP and inventory
Whether a batch is running over cost before it's packaged.
WholesaleDistributor depletions
Which account is slipping before the next depletion report comes out.
FinancialsAccounting
Where the P&L changed, and why, before the month closes.
Live today: the connected data, checked every night, and the dashboards and weekly summaries built on it for the breweries I work with.
One brewery's sales team runs the Spotlight in the field today, and a fast-paced brewery operations team has run a proof of concept, with a second one in the works. Their feedback is shaping what comes next.
See it working, starting with sales.
Sales is the first part of the brewery running on it today. Here's how it works for a sales team on a demo brewery: the Spotlight each person gets every week, the Plan, and the Brief before each meeting.
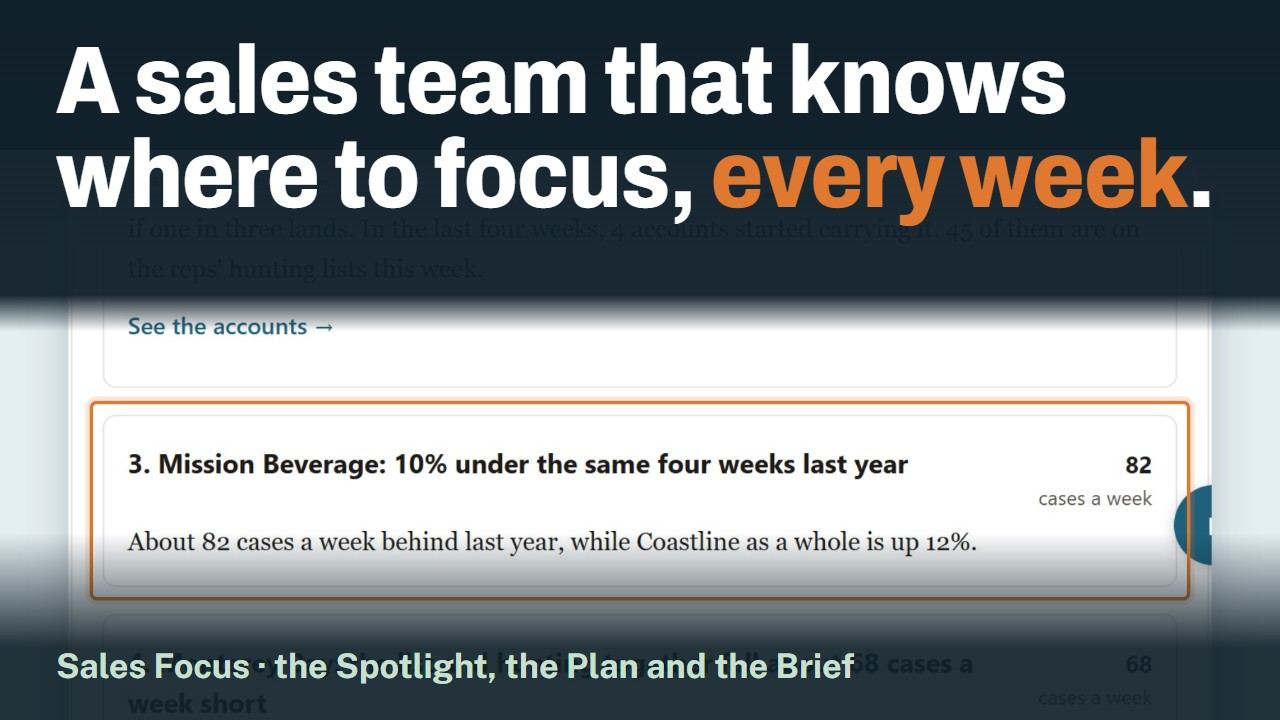
Good morning, Sam. Coastline is on pace for 97% of the quarter's goal, a little short.
89% against a goal of 95%, down from 91% four weeks ago. Most of the gap is in Jordan's team.
79% against 82%, about the same as four weeks ago. Most of the gap is in Nina's team.
80% against 87%, down from 85% four weeks ago. Most of the gap is in Jordan's team.
Mission Beverage is short about 161 cases a week. Maya's list brings back about 90 of them.
- See how it works for a sales team
- Example: Sam's Spotlight, on a demo brewery
- Example: the Quarterly Spotlight, on a demo brewery
The rest of the brewery comes next, on the same foundation.
Let's find the first place it could help your brewery.
It starts with a 30-minute conversation: what your team watches today, where the answers are slow to come, and which question to take on first.
One question, first.
Start with the question that matters most right now. Once I have access to the data and context I need, you get an answer back within a week: a clear picture, with ideas on what to go after first.
The Spotlight, for sales.
If sales is where you'd like to start, the Spotlight can usually start going out to your team the week after your depletions, CRM and goals are in.
Setup needs an hour or two from whoever knows your systems and the business best, mostly answering some questions from me.
Or email me at jeremy@centralcoast-analytics.com

I'm Jeremy Carney. I've spent about 20 years in data and technology, and the last few working with more than a dozen breweries and industry partners. More on how I work at centralcoast-analytics.com.